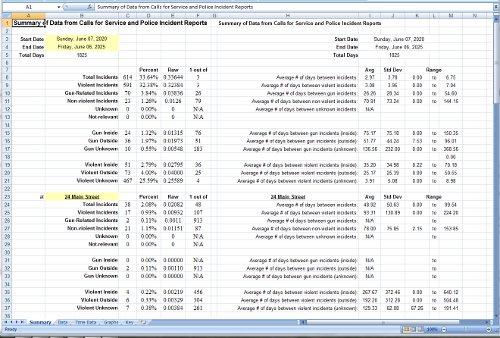
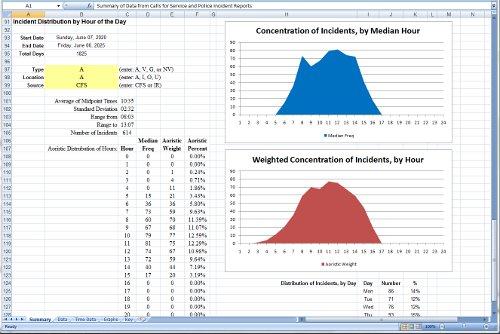
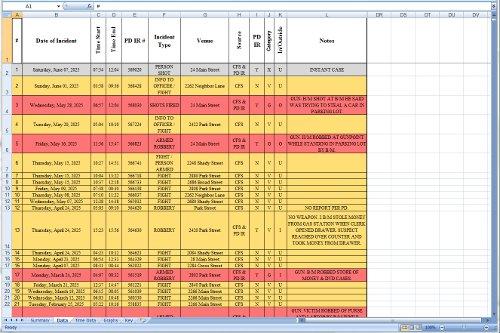
Quantitative Data ScreenshotsThe following screenshot samples are representative of just a few of the ways we graphically present quantitative data, which typically would include histograms, spreadsheets, probability calculations (including standard deviations), etc. Such graphic presentations of data, combined with well-articulated verbal and/or written opinions are an important part of what we offer our clients. The type of data entered (and the graphic presentation of that data) is the same, though the client may be any of the following:
Summary page, showing statistical probabilities and standard deviations:
Incident Distribution, showing temporal (by hour) concentrations of activity:
Data pages, showing details of events entered into spreadsheet for analysis:
|
Get An Objective AssessmentSince 1979 we have provided our expertise to hundreds of organizations including government agencies, Fortune 100 companies, private property owners and attorneys. Get Started > |


